Written by Aron Lander, Embedded Software Engineer at Percepio
This blog originally ran on the Percepio website. For more content like this, click here.
Using Tracealyzer to view applications running on Zephyr RTOS comes with a special challenge: unlike some other microcontroller-oriented real-time operating systems, Zephyr exposes its kernel services via a syscall layer. A syscall is essentially a way to programmatically communicate with the operating system kernel from user level code.
The advantage of this architecture is that it enables Zephyr to maintain a separation between userspace (application) code and kernel space code. However, this also means that each syscall will be considered an event by Tracealyzer, and an application can issue a lot of syscalls. Since syscalls are identified by name, which is a string, sending those names over the trace interface tends to be rather bandwidth intensive. This may result in missed events and incomplete traces, if using a trace streaming interface with insufficient throughput. To fix this, we came up with a solution we call the “Syscall Extension”.
A number and a name
Instead of identifying syscalls by name when sending them over the streamport, an integer identifier is assigned to each syscall. Once a syscall event reaches the Tracealyzer side, the integer is translated back to the appropriate syscall name. What makes this translation procedure possible is an additional step added to the build process, which causes the build system to generate a list of syscalls with corresponding identifiers and provide this list as a Tracealyzer extension, which in turn allows the Tracealyzer application to decode the identifiers sent by the TraceRecorder. The result is that the device side only has to send a single integer, rather than the complete syscall name, which ends up consuming a lot less bandwidth.
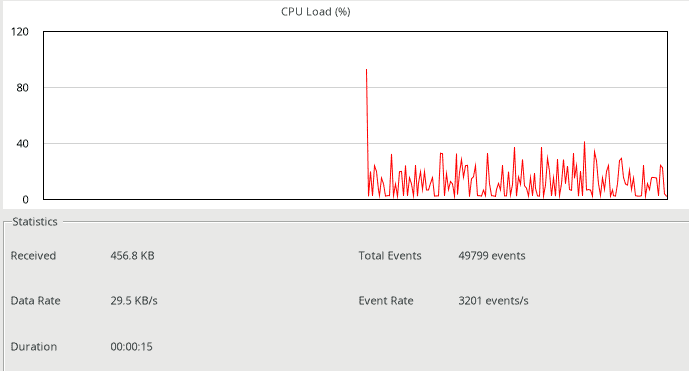
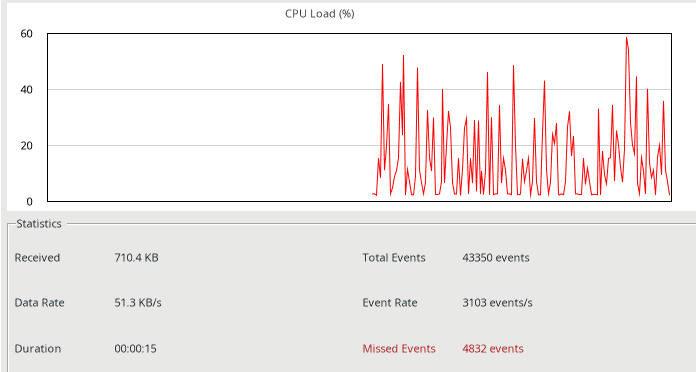
To illustrate the difference, I have prepared two separate traces: one where the syscall extension has been enabled (figure 1 below), and one where it is disabled (figure 2). As can be seen, enabling the syscall extension results in significantly less processor load on the target and less data being transmitted. Most importantly, no events are dropped with the extension enabled, compared to more than 10 percent dropped without it.

Figure 1 – Tracing a Zephyr target with the syscall extension enabled.

Figure 2 – Tracing a Zephyr target with the syscall extension disabled.
This sounds great, but how do I activate it?
To use this feature, you need to configure Zephyr itself to generate the extension file and send syscall identifiers instead of strings, and also to configure Tracealyzer to use the extension. Further information on how to do this can be found in the “Tracealyzer Getting started guide.”
Support for the new Syscall tracing is already available in Tracealyzer v4.8 on the application side. We are now integrating our updated solutions in the Zephyr repository to make it easy to get started. If you want to try this immediately, manual integration is also possible based on Zephyr v3.4 with some patches in the build system. Contact support@percepio.com for instructions.