Written by Rajeev Piyare of Conexio Technologies
Preface
Uptime is important for embedded devices, but guaranteeing uptime is challenging.
Having embedded devices that can work by themselves is a great time-saver as you can leave them to the task that they were designed for. Therefore, remotely located, devices need to be monitored to gain visibility and the status report on the performance. Such remote management tools can alert administrators when errors occur, the frequent device resets, or if devices fail to work at all so that errors can be identified and resolved quickly through means of remote firmware updates.
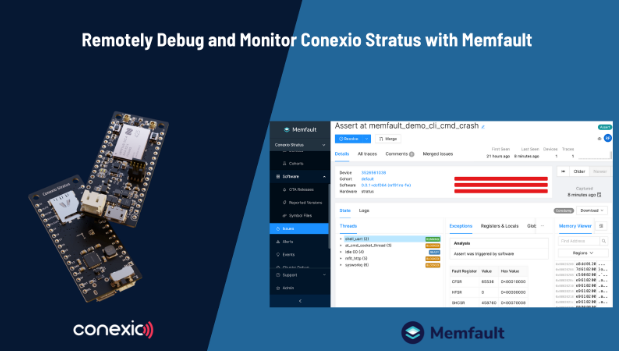
One such device observability platform is Memfault. Memfault is the first cloud-based platform for connected device monitoring, debugging, and updating, which brings the efficiencies and innovation of software development to hardware processes.
With Memfault cloud, users get access to the following features:
- Device monitoring: Memfault offers real-time reports on device check-ins and notifications of unexpected inactivity. Teams can view device and fleet health data like battery life, connectivity state, and memory usage or track release adoption and issues all from a single console using Memfault’s dashboards.
- Remote debugging: By aggregating issues across software releases and hardware revisions, Memfault can determine which devices are impacted and what stack they’re running. Teams can inspect backtraces, variables, and registers when encountering an error.
- OTA updates: Teams can deliver updates to specific devices at specific times. By controlling the timing of OTA updates, teams can schedule updates when users are least impacted. Devices can also be split into cohorts for targeted updates, and rollouts can be released in stages to limit fleet-wide issues from new updated versions.
At the moment, Memfault supports embedded IoT devices running various operating systems such as Zephyr RTOS as well as Android devices. And the good news is that the Memfault platform is currently free for the first 100 devices from Nordic Semiconductor whether it’s the nRF91, nRF53, or nRF52 series. That’s great as in this tutorial we are going to connect our nRF91 based cellular IoT platform, Conexio Stratus to the Memfault cloud.
This tutorial….
Covers how to connect the versatile Conexio Stratus device to the Memfault platform. Specifically, this post will demonstrate how to:
- Setup the toolchains and the Memfault API using the RF Connect SDK.
- Connect the Stratus kit to the Memfault cloud.
- Trigger fault cases and send crash data to the Memfault’s backend over the cellular network.
We have a lot to cover, so let’s dive in.
Required Toolchains
This tutorial assumes that one has already installed and set up the nRF Connect SDK v1.7.0 or later, the main toolchain required for building and compiling applications for the Stratus device. If not, please refer to this tutorial for getting up and running with the Stratus platform.
Registration and Device Setup on the Memfault Cloud
Sign up for the Memfault cloud and create a user account here.

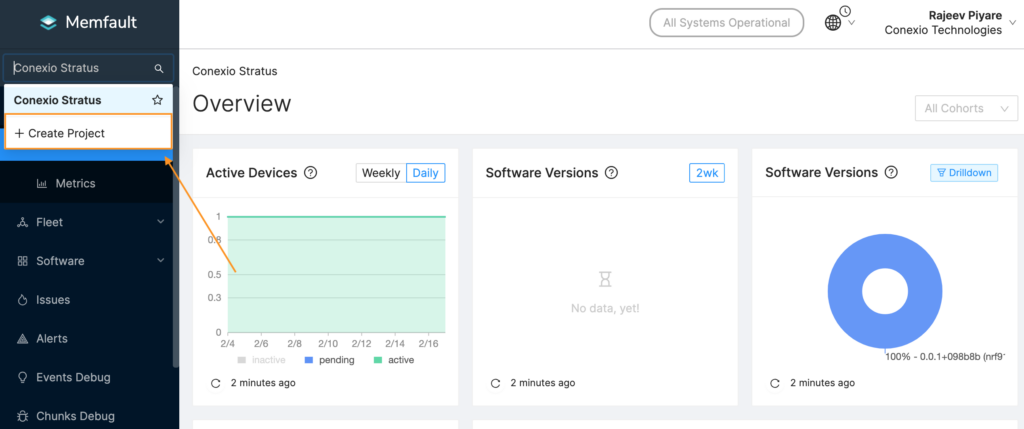
Once your account is created, create a new project in Memfault by navigating to the project selector in the left-hand sidebar. You can find an option to Create Project below your list of existing projects. More information regarding how to use the Memfault platform can be found here.
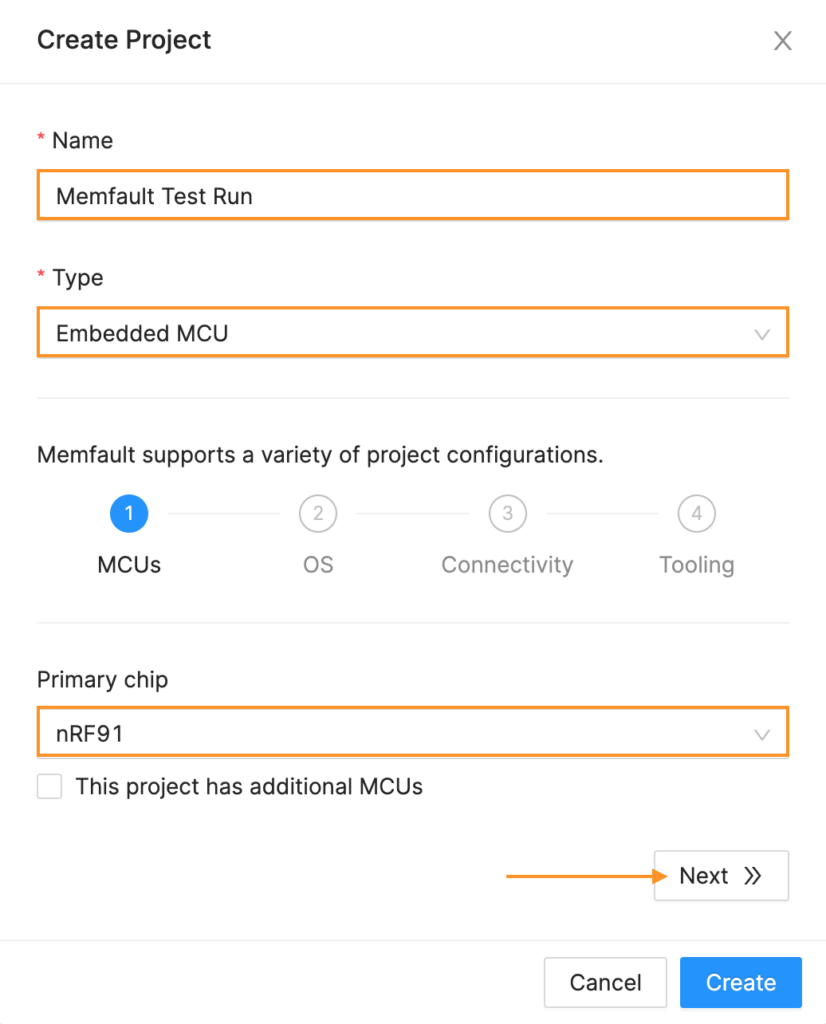
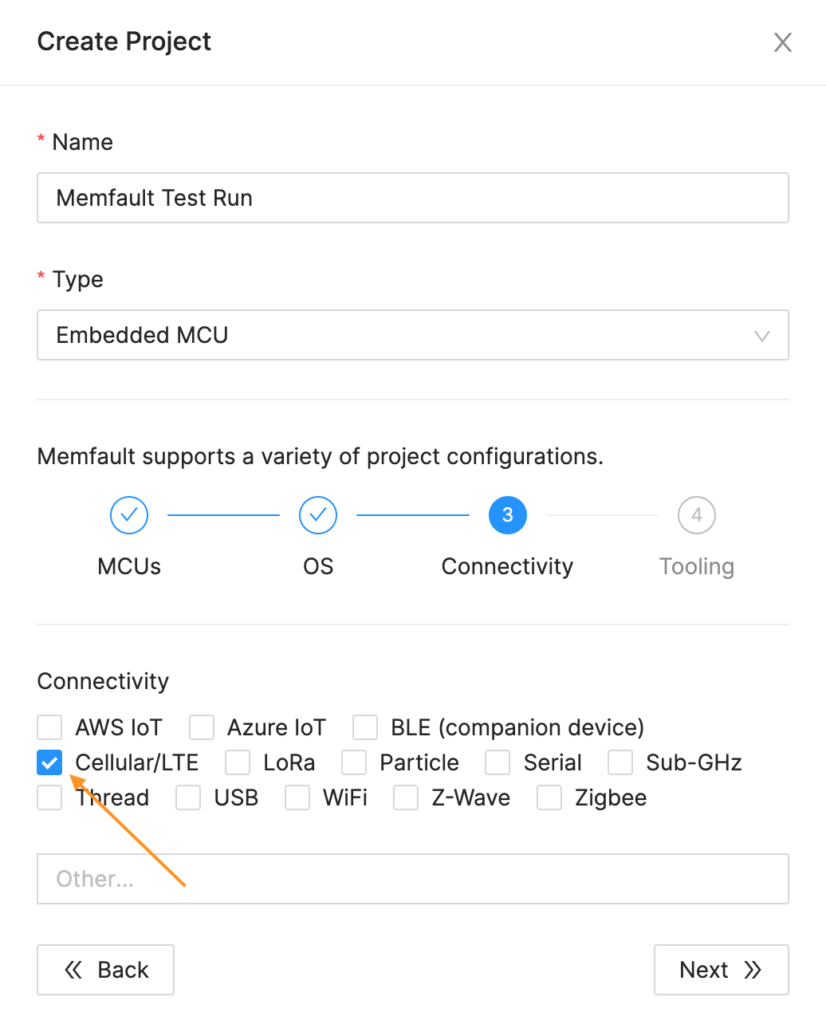
Click Create Project and give your project a preferred Name, followed by the MCU type. In our case, it will be the Embedded MCU with nRF91 as the Primary chip type.
Then click Next to choose the OS options.
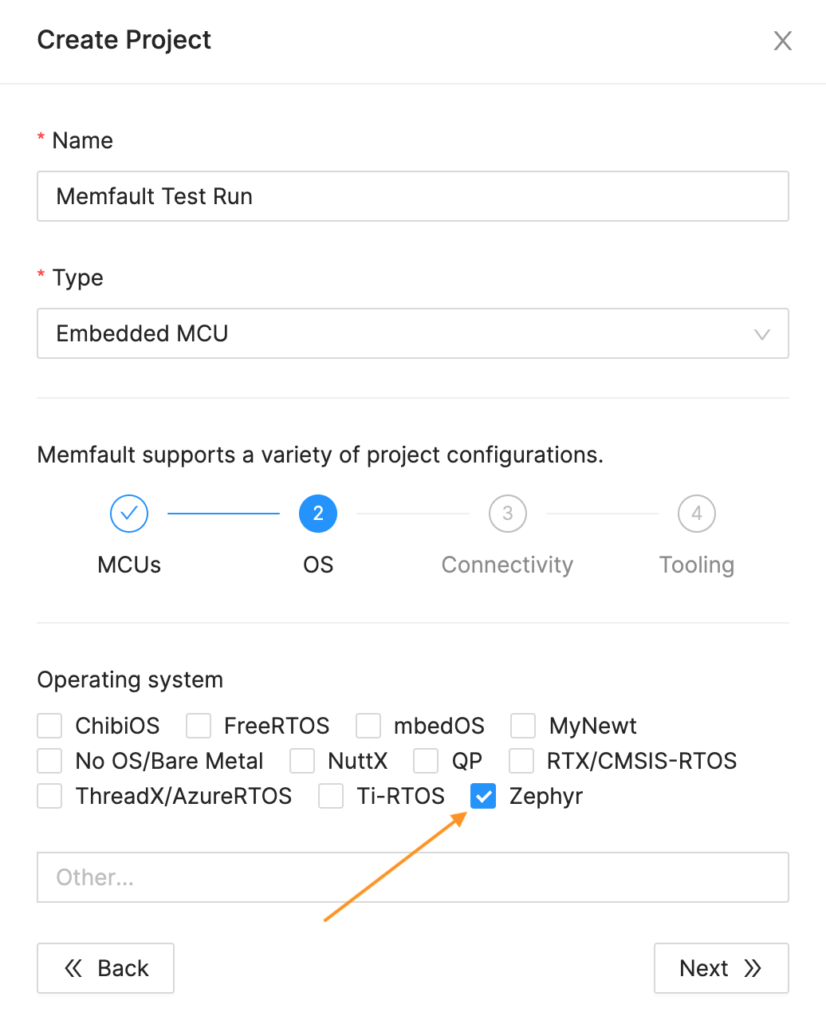
Under OS, we will select Zephyr as the main OS for our device. Hit Next and select the connectivity type.
For connectivity, Conexio Stratus is a Cellular/LTE device.
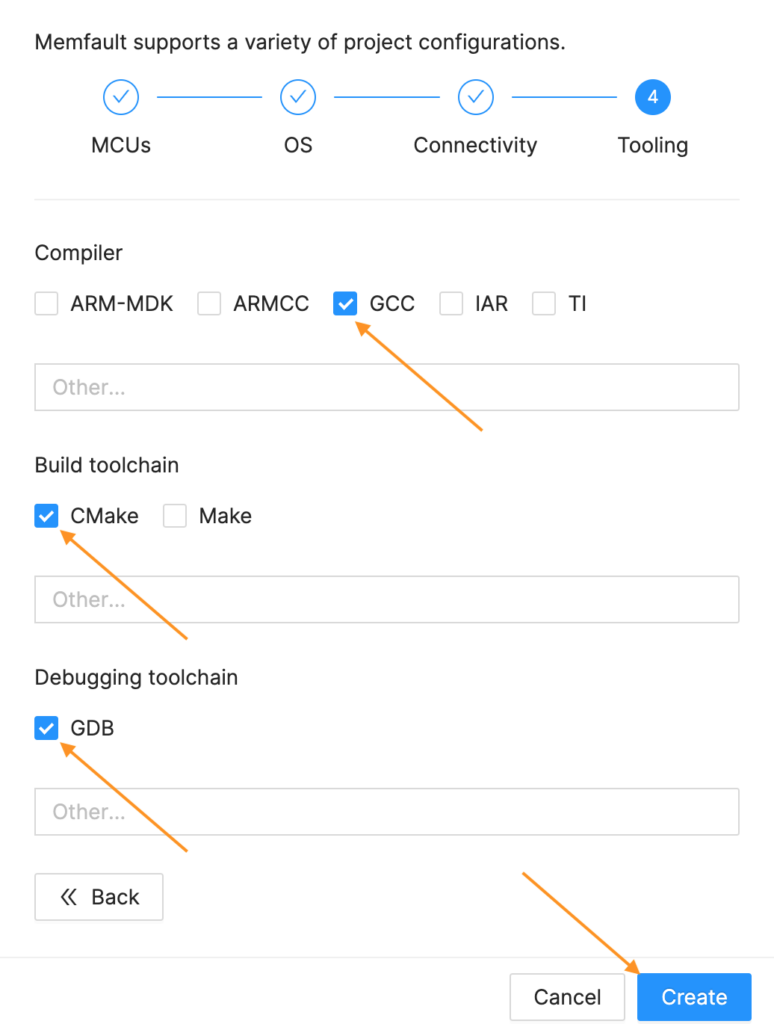
For the Tooling, we will select GCC as the main compiler and CMake as the toolchain used by the ZephyrOS. Finally, complete the project creation by hitting Create.
Once the project is created, head down to the Settings tab and click General. Here, you should see your Memfault Project Key on the right-hand box.
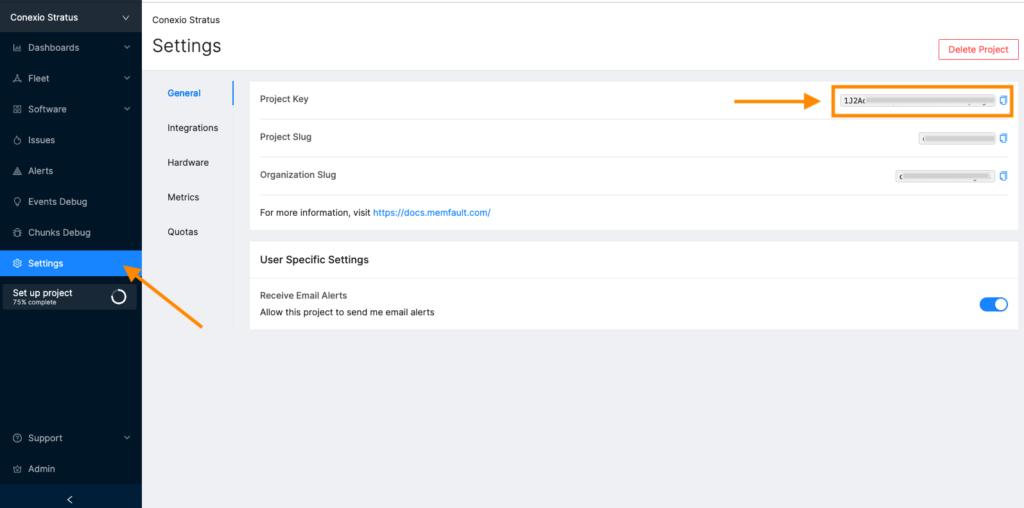
Copy this key as later we will need this to authenticate our Stratus device with the Memfault platform.
At this point, we have all the required details to connect and publish data from our Conexio Stratus device to the Memfault backend. Let’s head over to the device firmware setup and configuration side.
Stratus Sample Application
We have extended the memfault sample application provided in the nRF Connect SDK to connect the Stratus kit to the Memafult and stream device diagnostics data. The complete source code for this tutorial can be found in this GitHub repo. This sample application allows capturing:
- LTE metrics, specifically, the time to connect to the LTE network.
- Core dumps by triggering crash via button press or through shell commands.
- Offloading all the captured data to the Memfault backend.
Add Memfault credentials to the Application Code
First, we will have to add the Memfault Project Key that we copied above into the application code. To do so, edit the conexio_stratus_firmware/samples/memfault/prj.conf with your project key and update the following parameters.

To correctly fetch device hardware version and type together with the IMEI, the following configurations need to be added for the Stratus device:

In addition, we will also enable the periodic upload of the device diagnostics and heartbeat data over HTTP protocol by enabling:

This allows sending the data that has been captured by the device to the memfault cloud periodically with an interval defined by:

You can browse other configurations in the prj.conf file. Now we are all set to compile and upload our firmware to the device.
Compiling the Sample Application using West
To compile the application using west, open a terminal window in the application directory and issue the following command:

In case you do not want to recall the west commands simply command the following in the terminal, and the included python script in the project directory will take care of the rest.

Flashing the Sample Application
Once the application is compiled successfully, connect the Stratus device to the USB port and put it into the DFU mode.
Then flash the compiled firmware using newtmgr:

Open up a serial console with a baud rate of 115200, hit the reset button on the Stratus device, and the following serial UART output will be displayed in the terminal.
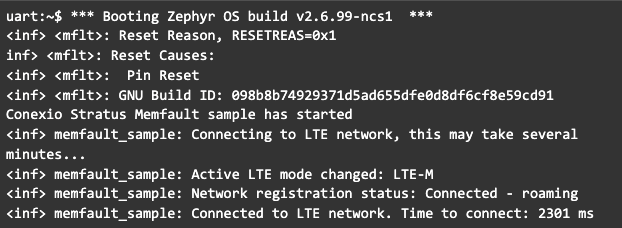
Once the device is booted up and connected to the available LTE network, it will then display the time-to-connect metric (Ncs_LteTimeToConnect) on the terminal. Subsequently, all the captured Memfault data including the reset reason will be sent to the Memfault cloud.

Uploading Symbol Files
In order to properly decode and parse the uploaded device data such as core dumps, Memfault needs to be able to find the Symbol File (ELF) that corresponds to the software that produced the uploaded data. Without an exact match, Memfault will not be able to decode the uploaded data.
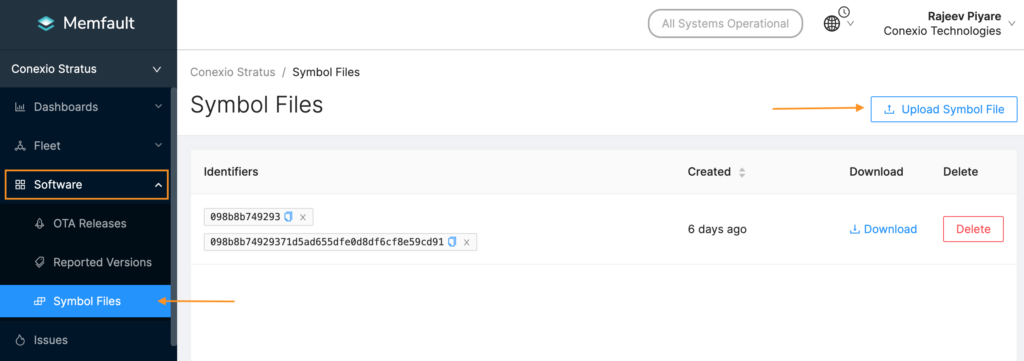
To upload the symbol file generated from your project build to your Memfault account, go to the Memfault console and select the project that you created earlier and navigate to the Software > Symbol Files in the left menu. Then click Upload Symbol File in the top right-hand corner.
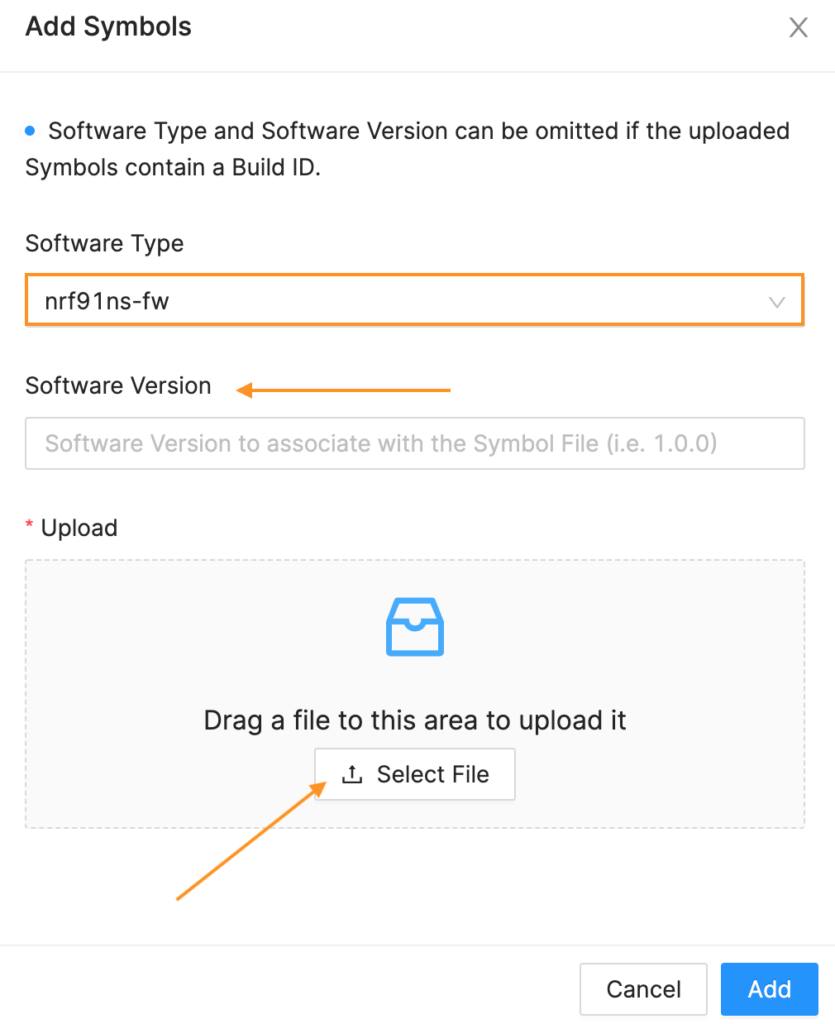
Select the Software Type and Version for your device and then click Select File. Browse and navigate to your project directory and select zephyr.elf file:
conexio_stratus_firmware/samples/memfault/build/zephyr/zephyr.elf
Finally, click Add to upload the Symbol file.
Exploring the Memfault Console
After uploading the symbol file, we can now see the parsed data on the Memfault console. Let’s explore the console and how we can see various metrics and the overall fleet information.
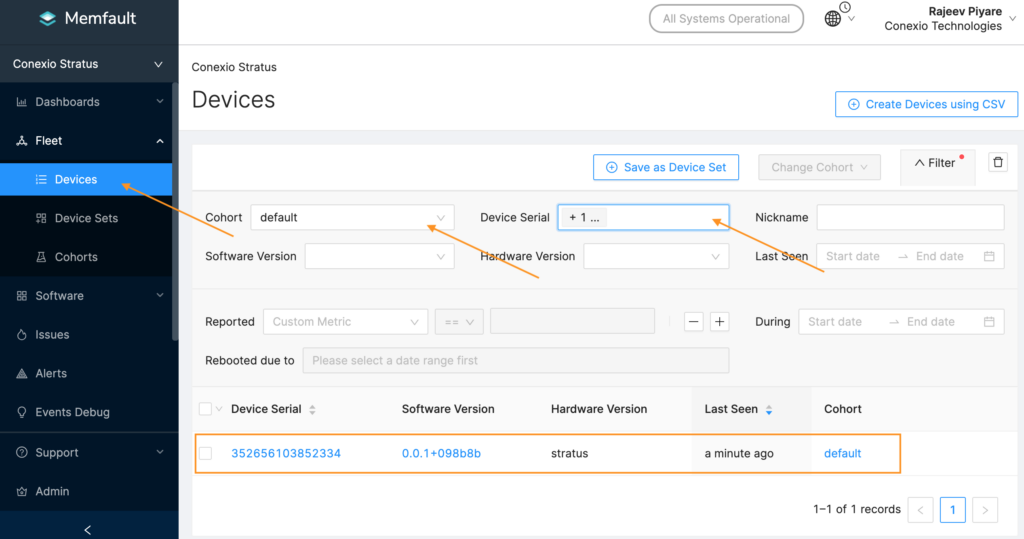
First, let’s see the connectivity status of our device. To view, click on the Fleet > Devices on the left-hand pane. Under Cohort (i.e., the grouping of devices), select default, and for the Device Serial select the IMEI number of the Stratus device. Next, it should display the device information of the connected devices. Here, we can see the firmware version running on the device (0.0.1+098b8b), the hardware version (stratus), and the last time device communicated to the Memfault cloud. If you see your device here, it confirms that it is able to successfully connect and offload the device data to the cloud backend.
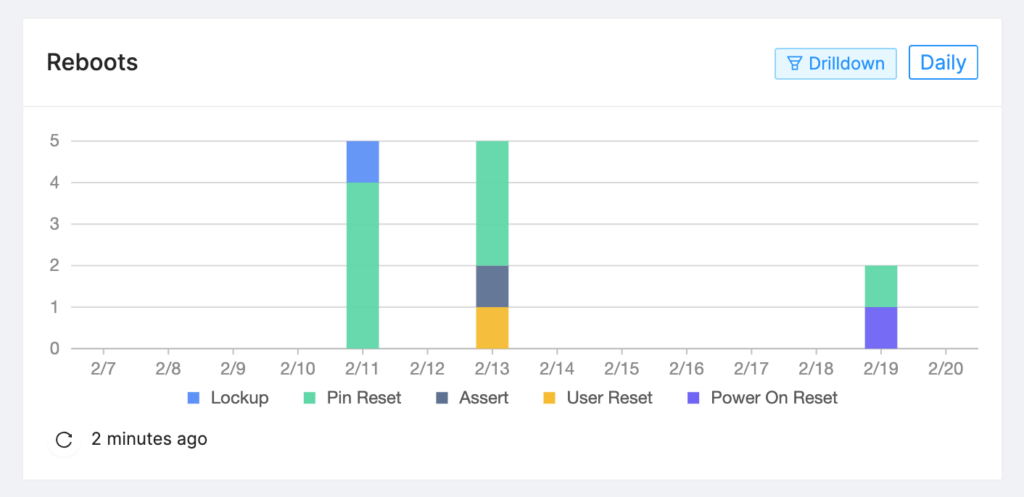
Next, in the Dashboard tab, clicking Overview should display the overall fleet status such as the number of active devices, software versions running on those devices, fault traces, issues, and the reboot reasons.
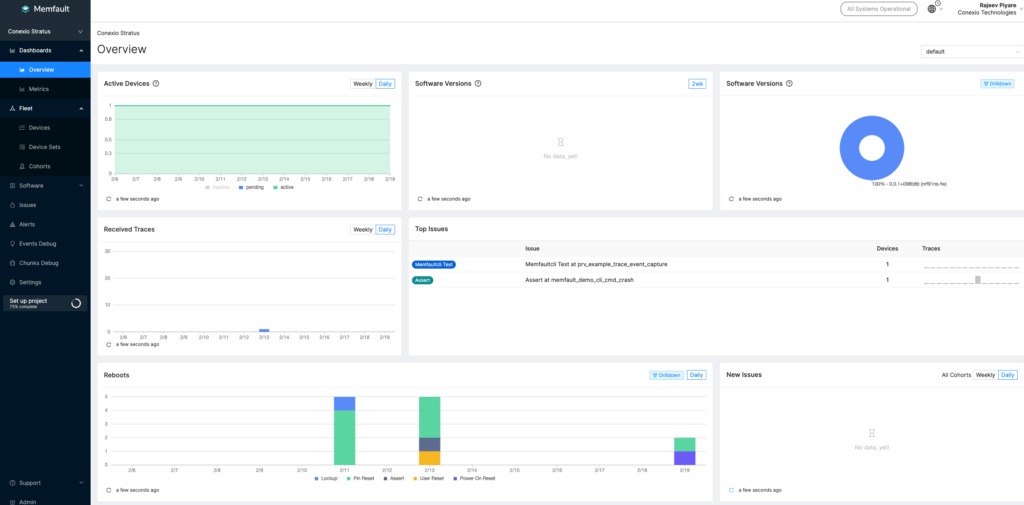
Device reboots can provide one of the vital insights to the IoT administrators as to what might be the root cause of issues on your device if it’s constantly failing or rebooting too often. This is usually a good starting point for troubleshooting. Device reboots can be caused due to mechanical or physical issues on the device such as power supply, faulty components, batteries, or software lockups, i,e., watchdog timers failing to kick, issues with drivers, etc.
Memafult is able to capture these issues and much more in detail.
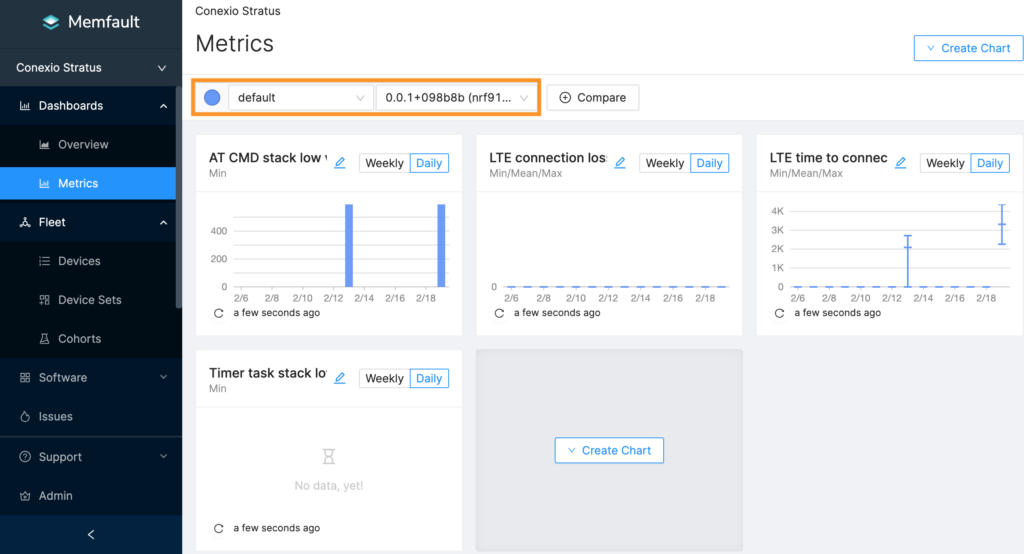
Let’s head over to the Metrics pane to view some of the metrics that we have captured using our sample application running on the Stratus device, i.e., LTE connectivity time and the stack usage metrics. Connectivity status provides good insights as to how long the devices across the fleet are taking to connect to the available LTE network. Longer connectivity times are a good indication for the poor cellular networks and whether devices in that particular region should utilize external or internal antennas for improving the connection – useful information for hardware design engineers.
Explore around the console to view other detailed analyses of faults reported by the device under the Issues tab.
Manual Coredump Collection
The sample application enables the Memfault shell by default which provides a serial terminal interface that can be used to issue commands to the device such as mflt crash to generate a coredump and mflt post_chunks to upload the coredump.

These coredumps can also be triggered by pressing button 1 (Mode button) on the Stratus device which triggers a stack overflow.
The shell offers multiple commands to test a wide range of functionality offered by the Memfault SDK. Run the command mflt help in the terminal for more information on the available commands. The list of available Memfault test commands is shown below.
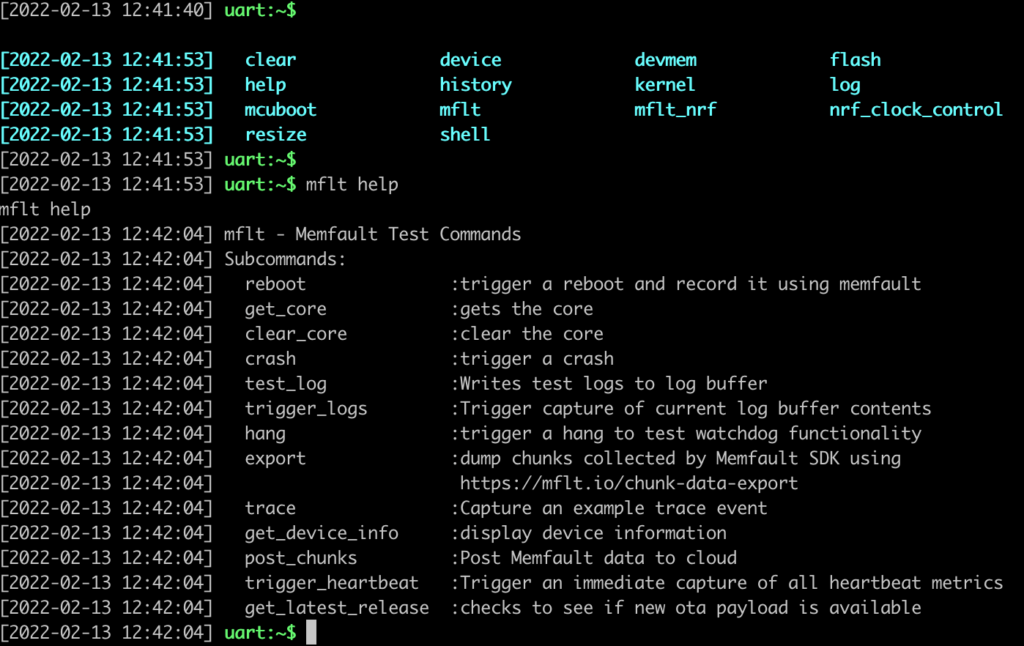
For instance, running mflt get_device_info displays all the relevant information of the connected device. Note: this is the same information that we have seen been captured by the Memfault cloud previously in their console under the devices tab.

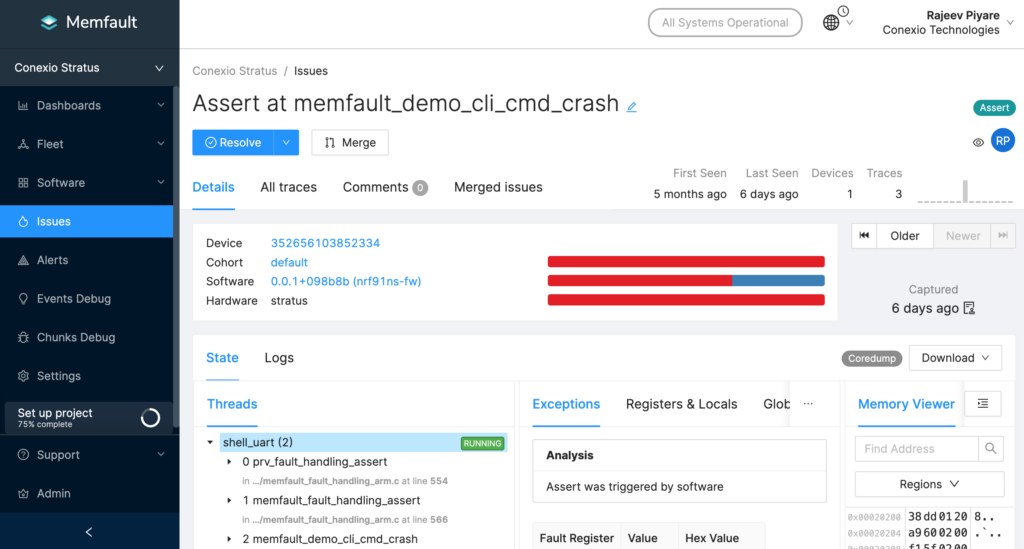
Now to trigger a device crash and submit the trace to the Memfault backend, we will submit mflt crash command. The crash causes the usage fault as shown below after which the device will reset and send the crash data to the Memfault cloud for further inspection and analysis.
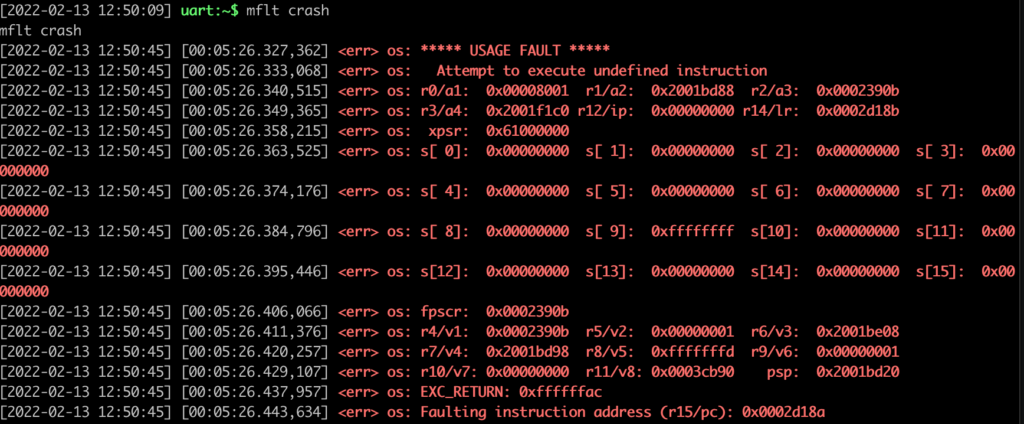
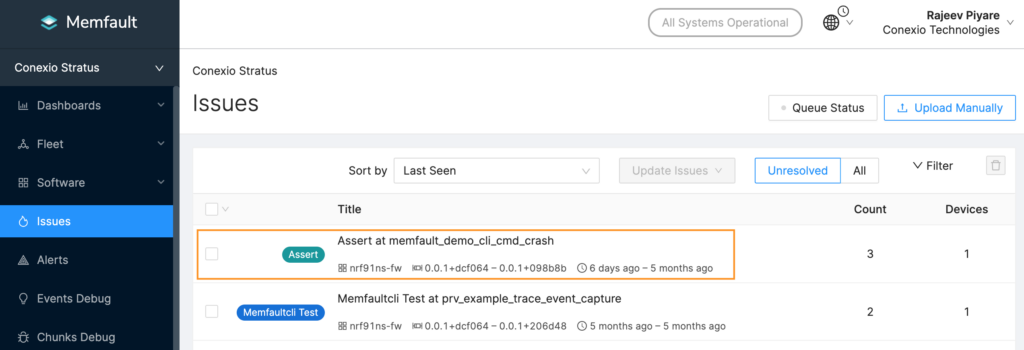
To view the device crash detail, head over to the Issues tab in the console and you should see the list of issues captured from this device. Here, the manual crash is registered as Assert at memfault_demo_cli_cmd_crash. Click on this issue to inspect in detail.
The detailed analysis allows us to get an in-depth view of the fault down to the register level. This is pretty interesting and helpful at the same time providing a readable and comprehensive view than what we would see with the gdb server.
And that wraps up this tutorial.
Conclusion
In this post, we have merely touched on all the features that the Memafult platform offers. However, this tutorial sets a solid foundation for connecting, monitoring, and remotely debugging your Stratus devices via the Memfault.
Other helpful resources regarding how to use Memfault and its features can be found here:
- Memfault platform documentation.
- Best practices for debugging Zephyr-based IoT applications.
- Is Memfault the Future of Fault Debugging?
For further questions regarding the Conexio Stratus platform or this tutorial, you can join our discussion forum.
Happy hacking!