Written by Phillip Johnston, Founder of Embedded Artistry
This article originally ran on the Embedded Artistry website. For more content like this, click here.
In the previous article, I talked about my experiences with debugging processor faults. I also gave you some high-level insights into the types of automated hard fault support tools I’ve helped build and used over the years. The sad truth is that if these kinds of tools are used at all (in my embedded adventures, they rarely are), they have to be custom-built for each company. This continual re-engineering effort represents significant money and time-to-market waste in our industry, especially in today’s increasingly competitive and agile landscape. Surely, we can do better.
While searching for potential solutions that you can integrate into your products, I mostly encountered fault-aware IDEs and debugging tools that aid us in the manual fault debugging process. Some RTOSes provide you with out-of-the-box support for fault analysis on the device, which gets us a step closer. But we’re still stuck implementing much of the support we need for automatic coredump collection, offloading, processing, and analysis.

There was one exception: I learned that the Memfault team provides a full-fledged fault debugging solution as part of their service offering. Even though I heard about the company in May 2019, I only thought of them as providing an OTA and fleet management service. I completely missed the additional debugging features they provide, which actually satisfy all of the “professional process” requirements we discussed in the previous article.
You probably know Memfault as the folks behind the outstanding Interrupt blog, one of the few websites that regularly stirs up feelings of professional jealousy due to the quality of their content. However, you may have overlooked the fact that these extremely knowledgeable folks also provide a software service for embedded systems developers.
I know the folks at Memfault and have great respect for them and what they are doing. Interrupt is without a doubt an outstanding embedded systems publication, so I was already primed and interested.
Table of Contents:
- Taking Memfault for a Test Drive
- Manual Coredump Collection
- Exploring the Web Interface
- End-to-end Testing
- Uploading Symbols with the CLI
- Ending on another Cool Feature
- Analysis
- Further Reading
Taking Memfault for a Test Drive
Unlike what I initially thought, Memfault provides much more than OTA update support. The complete service package is designed to help embedded systems development teams manage the firmware lifecycle. They help teams manage activities such as:
- Deploying new firmware to devices in the field (including controlled releases to specific cohorts)
- Monitoring health and performance of devices during pre- and post-deployment
- Remotely collecting and analyzing debug information for crashes, assertions, and other errors occurring in the field
- Automatically grouping similar error traces into issues and de-duplicating new error reports against existing issues
What really caught my eye is that the last two points map nicely onto the automated fault debugging processes I discussed in the previous article. I’m going to constrain my investigation to this feature set since we’re currently focused on automated fault debugging infrastructure. We’ll look into other capabilities in future articles.
Looking over the Memfault documentation, I see that the team has a working port for the nRF Connect SDK. I’ve been itching to play with the nRF91 Development Kit sitting on my shelf, so this investigation will give me the perfect opportunity to kill two birds with one stone. A walk-through of my experience using this development kit with Memfault follows.
Note: I used the
asset_trackerandhttps_clientexample applications in the nRF Connect SDK for testing out Memfault.
Manual Coredump Collection
The Memfault team provides a clever way to test out the system even before doing any integration work on our end. They do this by collecting a coredump through gdb, which can then be uploaded to their website for post-processing.
Note: You can try out this manual coredump collection process yourself if you’d like. You could also integrate the Memfault SDK or build one of their sample applications, but you will still need to manually upload coredumps with this demo version. If you want to test their service further, contact the Memfault team to discuss getting set up with a sandbox account.
Before we get started, we need to make sure the application is configured so that Memfault can recover my Zephyr task states, which is done by enabling the CONFIG_OPENOCD_SUPPORT option in Kconfig (or the proj.conf file). Once the option is set, we’ll need to rebuild the program and flash the device.
$ west build -b nrf9160dk_nrf9160ns
$ west flash
Since my dev board has JLink On-board, I will be using JLink’s gdb server for collecting the coredump. Then I’ll connect to the device with arm-none-eabi-gdb-py. The -py version of the program is required: Memfault’s gdb/Python scripts are used to execute this process.
# One terminal: Launch the server
$ JLinkGDBServer -if swd -device nRF9160_xxAA -nogui

# Another terminal: Launch gdb, auto-connect to the server, and load the application
$ arm-none-eabi-gdb-py --eval-command="target remote localhost:2331" --se=build/zephyr/zephyr.elf
Next, we load the Memfault Python script:
(gdb) python exec('try:\n from urllib2 import urlopen\nexcept:\n from urllib.request import urlopen'); exec(urlopen('https://mflt.io/2YUpW3p').read())
Memfault Commands Initialized successfully.
The instructions prompted me to create a “User API key” for my account, which we can supply to the memfault login command (necessary in order to upload a coredump to their servers). In the web interface, we can generate a key. Then the website generates a command to copy-and-paste into gdb.
(gdb) memfault login phillip@embeddedartistry.com <key> -o embedded-artistry -p nrf91-dev
Authenticated successfully!
Now we need to trigger a coredump and submit a trace using the memfault coredump command. The command throws up a prompt, making sure you know that the memory contents and binary file will be sent to their servers for debugging analysis.
(gdb) memfault coredump

You are about to capture a coredump from the attached target.
This means that memory contents of the target will be captured
and sent to Memfault's web server for analysis. The currently
loaded binary file (.elf) will be sent as well, because it
contains debugging information (symbols) that are needed for
Memfault's analysis to work correctly.

Memfault will never share your data, coredumps, binary files (.elf)
or other proprietary information with other companies or anyone else.

Proceed? [y/n]
Of course, we will proceed!
y
One moment please, capturing memory...
Collected MPU config
No capturing regions were specified; will default to capturing the first 1MB for each used RAM address range.
Tip: optionally, you can use `--region <addr> <size>` to manually specify capturing regions and increase capturing speed.
Capturing RAM @ 0x20000000 (1048576 bytes)...
Captured RAM @ 0x20000000 (1048576 bytes)
Uploading symbols...
Done!
Coredump uploaded successfully!
Once it has been processed, it will appear here:
https://app.memfault.com/organizations/embedded-artistry/projects/nrf91-dev/issues?live
This default capture is quite large, grabbing 1 MB from RAM. You can control this so that the coredump captures more or less memory using the --region argument, which takes in an address and a size. For example, the capture can be reduced to 262 kB, which also goes much faster.
(gdb) memfault coredump -r 0x20000000 0x40000
One moment please, capturing memory...
Collected MPU config
Capturing RAM @ 0x20000000 (262144 bytes)...
Captured RAM @ 0x20000000 (262144 bytes)
Symbols have already been uploaded, skipping!
Coredump uploaded successfully!
Once it has been processed, it will appear here:
https://app.memfault.com/organizations/embedded-artistry/projects/nrf91-dev/issues?live
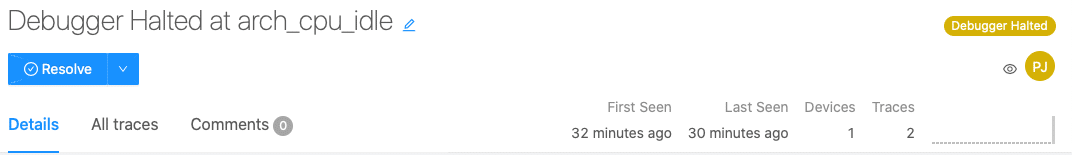
If you’re following along with the demo on the website, you can click the View Details link to access the coredump analysis page. I also received an email notifying me that there is a new issue for my project. This was an unexpected feature, but I was glad to see it. We can get notified right away when there are new issues that come in from the field, and that issue will be automatically tracked in the issue tracking system.
Subject: New Issue #30575: Debugger Halted at arch_cpu_idle

SUMMARY
A new Issue has occurred in Project: nrf91-dev

#30575: Debugger Halted at arch_cpu_idle

SOFTWARE VERSION
1.0.0-md5+762c9dde

COHORT
default

DEVICE
Serial: DEMOSERIALNUMBER
Hardware Version: DEVBOARD

ISSUE DETAIL
https://app.memfault.com/organizations/embedded-artistry/projects/nrf91-dev/issues/30575
This is a major step forward compared to the approaches I’ve encountered in the past. While coredumps collection and uploading will often happen automatically, generally a human still needs to manually process them and file an issue.
Exploring the Web Interface
The Issue page (linked in the email and via View Details in the web site) takes us to a detailed analysis of our coredump. I imagine that the reported contents differ across processors and SDKs depending on the state of their ports and the information that you have chosen to collect on a given platform (for example, the MPU pane is disabled for me).
For the nRF91/Zephyr, we can see:
- The state of each thread, including a backtrace
- Exceptions / Fault register status (for ARM: CFSR, HFSR, SHCSR)
- Processor registers and Local Variables
- Global and Static Variables and their values
- I noticed that some variables are marked as “not captured”. See the note below the gallery for more information.
- ISR Analysis, showing the state of different interrupts (two are pending in my case), their priority, and the “Exception number”
- Memory Viewer, which provides the raw memory contents of the binary and RAM while allowing you to jump to (and highlight) different regions that were collected
- That is SO MUCH EASIER than doing this manually in a binary viewer/editor and checking against a map file
-

A full look at the Issue window, showing all of the information collected from our coredump.


A full look at the Issue window, showing all of the information collected from our coredump.
Note: Regarding variables that are “not captured”, I spoke with the Memfault team, and they clarified that this occurs when the variable was not present in the memory location that was collected when generating the coredump. The default port does not grab
.bss, for example. This behavior is configurable on your system, allowing you to collect the pieces of memory that you care about most. You can tune the coredump from a few stack frames to the entire memory contents. However, picking exactly what to keep is an artform when you are working with limited memory and communication bandwidth.
Because I collected multiple traces while testing this out, I can navigate between them from within the same issue – Memfault automatically grouped them together. I also notice there’s a Devices stat, which currently shows 1 since I have one board, but this is nice to see how many devices in our fleet are actually impacted by this particular issue.
The issue also has a category, in this case Debugger Halted. Other categories I’ve seen in my testing are Assert and Hard Fault.
Note: You can also create custom error categories, which I will discuss in the next article.
End-to-end Testing
Of course, we don’t really want to manually collect and upload coredumps for processing every time we run into one. That defeats the point of this research exercise. What we really want is for coredumps to be automatically uploaded from the device. To do that, we need to integrate their SDK into our system.
My goal in this section is to:
- Integrate Memfault into our project’s source code + build
- Inject and trigger a fault case
- Automate the process for sending crash data up to Memfault’s backend
Note: At this point, you could also try out a pre-built demo application, which allows you to test drive this process before integrating it into your SDK. These applications provide you with a serial terminal interface that can be used to issue commands to the device, such as
mflt crashto generate a coredump andmflt post_chunksto upload the coredump.
Integrating the SDK
Now, I already have an nRF Connect SDK setup working on my computer. If you don’t, you’ll need to start with these instructions. Memfault also helpfully provides their own nRF Connect SDK Integration Guide, which I followed to accomplish the steps below.
First, we need to add the Memfault SDK to the projects section of nrf/west.yml.
    - name: memfault-firmware-sdk
      url: https://github.com/memfault/memfault-firmware-sdk
      path: modules/memfault-firmware-sdk
      revision: master
Next, we need to add the Memfault SDK to the ZEPHYR_EXTRA_MODULES list in our project’s CMakeLists.txt file.
Note: I’m using the
asset_trackerapplication (nrf/applications/asset_tracker), but I also tested this withhttps_client(nrf/samples/nrf9160/https_client).
# Added the line below this comment
list(APPEND ZEPHYR_EXTRA_MODULES $ENV{ZEPHYR_BASE}/../modules/memfault-firmware-sdk/ports/nrf-connect-sdk)

find_package(Zephyr REQUIRED HINTS $ENV{ZEPHYR_BASE})
project(asset_tracker)
zephyr_compile_definitions(PROJECT_NAME=${PROJECT_NAME})
zephyr_compile_definitions(_POSIX_C_SOURCE=200809L)
Next, we need to update the project’s .conf files. First is prj.conf, which is the configuration file for our user application. Here, we want to enable CONFIG_OPENOCD_SUPPORT. We also want to enable CONFIG_MODEM_KEY_MGMT, which is necessary for building the Memfault SDK.
CONFIG_OPENOCD_SUPPORT=y
CONFIG_MODEM_KEY_MGMT=y
Note:
CONFIG_MODEM_KEY_MGMTis already enabled forhttps_client. You can tell that you need to enable this option if you get a linker error for an undefined reference tomodem_key_mgmt_write.
While we’re in prj.conf, we need to disable the Memfault UART shell if we’re building asset_tracker, because the example application forwards UART input as AT commands to the LTE modem. If you’re using https_client or any other sample application, you may not need to take this step.
# This is disabled because the UART is being forwarded to the modem
# as AT commands.
CONFIG_MEMFAULT_SHELL=n
We’re only using Memfault in our application, so we need to add an option that disables Memfault’s SDK in mcuboot_overlay-rsa.conf and spm.conf:
CONFIG_MEMFAULT=n
Now that the configuration is taken care of, we need to implement a few dependencies and initialize the SDK. First on the list is a function that will populate the sMemfaultDeviceInfo structure for our product. I’m going to make a new file in src/ called memfault.c(and add it to my build) which implements this function. I’m also going to add the definition for the project API key to the build (this is not the same as your user API key – you can find the project API key on the Settings page in the web application)..
#include "memfault/core/platform/device_info.h"
#include "memfault/http/http_client.h"
#include "autoconf.h"

#define STRINGIFY_(val) #val
/** Converts a macro argument into a character constant.
 */
#define STRINGIFY(val)  STRINGIFY_(val)

void memfault_platform_get_device_info(sMemfaultDeviceInfo *info) {
  // platform specific version information
  *info = (sMemfaultDeviceInfo) {
    .device_serial = "960026121", // Hard-coded for the example
    .software_type = STRINGIFY(PROJECT_NAME),
   	.software_version = STRINGIFY(APP_VERSION),
    .hardware_version = CONFIG_BOARD,
  };
}

sMfltHttpClientConfig g_mflt_http_client_config = {
  .api_key = "<PROJECT_API_KEY>",
};
Next, in main.c, we need to call memfault_nrfconnect_port_install_root_certs() before we initialize the LTE modem using lte_lc_init_and_connect(). I added this function in main() before modem_configure() is called, since that handles modem setup. I also need to #include "memfault/nrfconnect_port/http.h" at the top of the file.
// .. Lots of code

cloud_api_init();
memfault_nrfconnect_port_install_root_certs();

// ... Lots more code
Finally, we’re directed to create a “trace reasons definition file”. This file must be named memfault_trace_reason_user_config.defand placed in the include directory search path for your build. We’ll create this file in the recommended config sub-directory:
$ mkdir config
$ touch config/memfault_trace_reason_user_config.def
Finally, we need to add this new directory to our build rules:
zephyr_include_directories(config)
Generating Faults
At this point, the project builds, flashes, and runs successfully. Because we have integrated the SDK (with a working port), we now have all the pieces in place that we need for automatically generating a coredump in software, saving it to RAM, and automatically rebooting the device. However, the example application itself doesn’t exhibit any crashes, so we need to insert some to test out this support.
The easiest approach is to place a MEMFAULT_ASSERT(0) call somewhere in main, but this would cause a failure loop and would likely flood the server with problems. Instead, we can simulate intermittent problems by generating a random seed and using it to trigger different faults.
/* Outside of main() */
#include <random/rand32.h>

/* In main() */
// To test out the application we are going to generate a random seed,
// which can be used to generate non-fixed error simulation behavior in our system.
uint32_t seed = sys_rand32_get();
LOG_INF("Generated random seed: %u\n.", seed);
Before the modem is initialized, I added a set of if statements that trigger intermittent asserts and faults. You can vary the fault occurrence frequencies by changing the divisors.
/* Outside of main() */

// Jump through some hoops to trick the compiler into doing an unaligned 64 bit access
__attribute__((aligned(4))) static uint8_t s_test_buffer[16];
void *g_forced_unaligned_buffer = &s_test_buffer[1];
// Also jump through some more hoops to trick the compiler into executing a bad function
void (*g_forced_bad_func_call)(void) = (void (*)(void))0xbadcafe;

/* In main() */
if(seed % 7 == 0)
{
	LOG_ERR("SIMULATING ASSERTION\n");
	MEMFAULT_ASSERT(0);
}
if(seed % 5 == 0)
{
	LOG_ERR("SIMULATING BAD FUNCTION CALL\n");
	g_forced_bad_func_call();
}
if(seed % 13 == 0)
{
	LOG_ERR("SIMULATING BAD BUFFER WRITE\n");
	uint64_t *buf = g_forced_unaligned_buffer;
    *buf = 0xbadcafe0000;
}
Each of these situations is sufficient to generate a coredump.
Automating Uploads
The next piece to handle is automatically uploading the crash data when it occurs. Now, you might put this on a thread, but I think this is the perfect kind of work for using an asynchronous dispatch queue. Luckily, Zephyr provides these (called “work queues”). We can even create “delayed work queues,” which will execute a task after a specified amount of time has passed.
In main, after we’ve connected to LTE, I will initialize the work queue object and invoke the function.
/* outside of main() */
static struct k_delayed_work memfault_update_work;

/* In main() */
k_delayed_work_init(&memfault_update_work, memfault_update_handler);
memfault_update_handler(NULL);
This function checks to see if data is available on the device. If so, it will post the data to Memfault’s backend. Then the function will re-enqueue itself in the work queue with a delay (once per minute in my example program).
static void memfault_update_handler(struct k_work *work)
{
	(void) work;
	if(memfault_packetizer_data_available())
	{
		memfault_nrfconnect_port_post_data();
	}

	// We re-enqueue this work for a future time
	k_delayed_work_submit_to_queue(&application_work_q,
		&memfault_update_work,
		K_SECONDS(MEMFAULT_UPDATE_DELAY_S));
}
With this support, we’ve now automated the “collect the coredump” process step.
Testing Our Work
We can connect to our device using a serial terminal, such as picocom or miniterm.py.
$ picocom -b 115200 /dev/tty.usbmodem0009600261211
Then we can build and flash our program using west:
$ west build -b nrf9160dk_nrf9160ns
$ west flash
The first time I booted the device, everything was fine. So I hit the reset button until I came across one of the simulated faults:
[00:00:00.458,709] <err> asset_tracker: SIMULATING BAD FUNCTION CALL

[00:00:00.465,789] <err> os: ***** BUS FAULT *****
[00:00:00.471,282] <err> os:   Instruction bus error
[00:00:00.476,959] <err> os: r0/a1:  0x00000000  r1/a2:  0x00000000  r2/a3:  0x00000000
[00:00:00.485,687] <err> os: r3/a4:  0x0badcafe r12/ip:  0xa0000000 r14/lr:  0x00022ea1
[00:00:00.494,415] <err> os:  xpsr:  0x60040000
[00:00:00.499,633] <err> os: s[ 0]:  0x00000001  s[ 1]:  0x00000001  s[ 2]:  0x00000001  s[ 3]:  0x00000001
[00:00:00.510,131] <err> os: s[ 4]:  0x00000001  s[ 5]:  0x00000001  s[ 6]:  0x00000001  s[ 7]:  0x00000001
[00:00:00.520,599] <err> os: s[ 8]:  0x00000001  s[ 9]:  0x00000001  s[10]:  0x00000001  s[11]:  0x00000001
[00:00:00.531,066] <err> os: s[12]:  0x00000001  s[13]:  0x00000001  s[14]:  0x00000001  s[15]:  0x00000001
[00:00:00.541,534] <err> os: fpscr:  0x00000000
[00:00:00.546,783] <err> os: r4/v1:  0x00000080  r5/v2:  0xe5b6a973  r6/v3:  0x0003e8eb
[00:00:00.555,511] <err> os: r7/v4:  0x00000000  r8/v5:  0x20035ef8  r9/v6:  0x0003e8c5
[00:00:00.564,239] <err> os: r10/v7: 0x20036838  r11/v8: 0x20036710    psp:  0x20035e50
[00:00:00.572,967] <err> os: Faulting instruction address (r15/pc): 0x0badcafe
The device automatically resets and reboots. This time there was no crash, and later in the logs I can see Memfault data uploaded successfully:
<dbg> <mflt>: Response Complete: Parse Status 0 HTTP Status 202!
<dbg> <mflt>: Body: Accepted
<dbg> <mflt>: No more data to send
I didn’t get an e-mail for this crash, so I went to check the Issues page. I see a note that “Unprocessed traces exist due to missing symbol file(s)” with a link that prompts me to upload my software version. I uploaded build/zephyr/zephyr.elf
-

We are prompted to upload symbols so that Memfault can process the newly collected coredump

We are prompted to upload symbols so that Memfault can process the newly collected coredump
Once the server processed the symbol file and coredump, I received a new issue email:
SUMMARY
A new Issue has occurred in Project: nrf91-dev

#32149: Hard Fault at 0xbadcafe

SOFTWARE VERSION
v1.4.99-dev1-15-gcf6d1ad96a5e

COHORT
default

DEVICE
Serial: 960026121
Hardware Version: nrf9160dk_nrf9160

ISSUE DETAIL
<https://app.memfault.com/organizations/embedded-artistry/projects/nrf91-dev/issues/32149>
Memfault’s backend handles the post-processing of the coredump for us, so we can see the bad function call address (0xbadcafe, defined in the example code above) as well as the line where I called that function in main.c.
I also noticed other useful features during testing: when I ran into a case where another bad function call simulation was triggered, the issue was automatically de-duplicated! Issues are updated with logs showing the number of devices that have exhibited that issue, the software versions that have exhibited that issue, and the total number of times each has occurred. This feature simplifies much of the drudgery involved with triaging new issues. It also helps us effectively prioritize our work, since we now have actual data that shows the impact of different issues in our system.
-

We can differentiate our software by both “type” and version.


We can differentiate our software by both “type” and version.
What Happens if There Are Multiple Crashes?
Sometimes, our system enters into a crash loop, where another crash occurs before we can upload the previously collected crash information. Each system handles this differently based on its available memory and crash data storage strategy.
During one of my test runs with the https_client application, the random seed caused the device to hit a second assert condition before the first log was uploaded to the cloud. I expected that I would completely lose one set of fault information. However, I was pleasantly surprised to see that two issues were created on the Memfault backend. One issue had the full coredump, and the other issue only contained the backtrace for the thread which encountered the assert (including the line number where the assert was triggered).
-

Both crashes were successfully uploaded.


Both crashes were successfully uploaded.
After this happened, I reached out to the team to learn about their design. Here’s the summary:
- The full coredump is saved if no crash is already stored in memory
- When a reset takes place, they also save a minimal set of information (
pc,lr) in a “reboot event” - If a coredump already exists in memory, it will not be overwritten, but the reboot events will still give you a small amount of information if multiple crashes are occurring before the device can send the data
The fact that this corner case was already elegantly handled speaks volumes about the amount of thoughtfulness that went into Memfault.
Uploading Symbols with the CLI
The process of manually uploading a .elf file every time there is an issue gets a bit onerous after a while. It can also be problematic when working with local builds, because you might find (as I did) that you have unprocessed coredumps on the server, but you no longer have the corresponding local build on your machine. Whoops!
Luckily, we can use the Memfault CLI Tool to automate the upload process (and for a number of other things).
Note: Not only does this save us a few button clicks, but it also means that any crashes generated for an uploaded version will be automatically parsed. We will be notified about new issues without having to check the Issues page. We can also use the CLI as part of our CI process, ensuring that new “official” builds are automatically posted to the server.
The CLI can be installed with pip:
$ pip3 install memfault-cli
The general structure of the upload command can be seen below. Here are the values for my example asset_tracker program. For your situation, of course, you will need to supply your own user key and version number.
$ memfault --email [phillip@embeddedartistry.com](mailto:phillip@embeddedartistry.com) --password ${YOUR_USER_API_KEY} \
  --org embedded-artistry \
  --project nrf91-dev \
  upload-symbols \
  --software-type asset_tracker \
  --software-version ${VERSION} \
  build/zephyr/zephyr.elf
Here is what you will see upon successful upload:
INFO: build/zephyr/zephyr.elf: ELF file with .debug_info
zephyr.elf: 100%|██████████████████████████████████| 1.47M/1.47M [00:07<00:00, 202kB/s]
INFO: build/zephyr/zephyr.elf: uploaded!
You can view in the UI here:
   https://app.memfault.com/organizations/embedded-artistry/projects/nrf91-dev/software/asset_tracker/versions/v1.4.99-dev1-14-ge1b2da65c492
Of course, I would make this a common shell alias for my project:
$ memfault-upload-zephyr
If your version number is generated by your build system, you might be better off creating a command alias there so that the number is automatically picked up for the Memfault command.
Ending on another Cool Feature
Now, looking at this latest coredump, I suddenly became curious. In gdb, I will often go to previous stack frames and get the local variables in that frame, which can help me get a picture of the events leading up to the crash. I wondered if the “Registers and Locals” pane in the Memfault output actually changed based on the stack frames – because that would be a great feature.
Indeed, it works that way!
Analysis
If you’re looking for an out-of-the-box remote debugging and fault analysis service, Memfault seems to be your one-stop shop. Each of the automated fault debugging processes we discussed in the previous article has already been tackled by the team:
- Generating a coredump in software whenever a fault or assertion occurs
- Saving the coredump (to RAM by default, but you can also store coredumps in flash)
- Automatically collecting the coredump from the device (via cellular connection in this case)
- Post-processing the coredump using the debug information in the corresponding
.elffile - Automatically opening new issues when a crash occurs in the field and de-duplicating new reports against existing issues
- In this area in particular, Memfault has surpassed all of the other implementations I have encountered in my career. Typically, this step is stuck as a manual process.
Memfault automates much of the fault debugging process for us by automatically collecting and decoding fault information, providing backtraces, and symbolicating addresses. We also get a snapshot of local variables, global variables, thread statuses (if configured for your system), and more. This information is presented in a readable dashboard, which gives us a more comprehensive view than what we would see if we were just poking around with gdb.
Automatically getting reports about crashes that occur on your devices is a major step forward in terms of understanding what is happening to your devices in the field. Users rarely report issues unless they are catastrophic, and when they do, it is rarely with sufficient debug or reproduction information. Automatic crash reports let you know what issues are occurring, at what frequency, and with what software versions. This includes low probability issues that you may never hear about without automated reporting! Armed with this information, you can effectively prioritize issues using data from the field – a major improvement over prioritizing fixes based on the whims of the developers or the issues that annoy management the most.
Automated de-duplicating of issues is a tremendous time-saver resolving a major problem I’ve faced at multiple companies. Usually, someone has to manually go through each issue and figure out whether the report is new or a duplicate of an existing issue. Nobody enjoys this work, and it’s rarely the best use of an engineer or project manager’s time.
You can tune the information collected in a coredump according to your device’s memory availability, network connection, and debugging needs.
Manual coredump collection is useful for testing out Memfault, but it also enables you to collect and upload information during development when you have a debugger attached allowing you to capture coredumps without needing to hit an assertion or fault condition first. Since you are not operating under memory or network bandwidth constraints on your development machine, you can also use manual coredump collection to gather information beyond the default for devices in the field.
The Memfault team also provides excellent support, a critical part of any software service we come to rely on. The team is very responsive, and they fixed a few issues I reported right away. They have extensive documentation that makes it a straightforward job to get up-and-running with their SDK and its various features. A porting guide is provided in case you are bringing up the SDK on a brand new platform, and they provide guidance on topics such as getting your data to the cloud. Documentation is something I rely on quite heavily, and it’s refreshing to see a project with this level of coverage.
Overall, I found that these features made for a much-improved fault debugging experience. I can also see that Memfault really shines when you have a fleet of devices, whether that is in the field, in beta testing, or in a large test rack in your office. You can quickly gain insights into issues across the fleet, giving you real knowledge of issue severity.
There’s always the possibility that after reading all of this you’re thinking that you will just duplicate these features internally rather than paying for a service. I hope you consider how long that effort will take you, especially since the Memfault team has been working on their offering full-time for over two years (as of when this article was written). They already address a number of corner cases that you will re-discover for yourself. All I can say in that case is: Good luck!
Further Reading
- Ending the Embedded Software Dark Ages: Let’s Start With Processor Fault Debugging!
- Memfault
- Interrupt, truly one of the best embedded blogs on the ‘Net!
- Zephyr: Interactive Kconfig Interfaces
- Zephyr:
OPENOCD_SUPPORT